
Ranking Johnny Davis in History
A couple years ago, I compiled my list of Top Badger basketball players of recent history, which resulted in quite a stir among many Badger fans. One of the big questions when evaluating players in any sport is how do you value peak performance relative to career value? Depending on your criteria, you can reasonably arrive at very different conclusions, neither of which is wrong. We could say the same about pro performance, titles won, success of the team, playing era, and so on. How do you value Brian Calhoun, who played one year for the Badgers, vs. someone like PJ Hill, who was a somewhat unspectacular stat accumulator for multiple seasons?
This brings us to Johnny Davis and where he fits in the discussion of Badger basketball history. With the assumption that he is all but gone after the season, we know he is going to fall short in the career longevity department, so we are left with trying to rank his individual season. Where does he fit? Only a select few Badgers have been honored with Big Ten Player of the Year, with All-American and National POTY speculation, so the quick reaction would be somewhere towards the top, so let’s take a look.
First off, I would like to try to at least take a look at this objectively, or, as “objectively appearing” as we can make it. We all realize that stats are accumulated within a context…what are you asked to do, how good is the rest of your team, and so forth. Those arguments certainly have subjective value and can cause us to throw out numbers entirely in some cases. However, in my experience, I have found that the truly great players are able to support their play with the analytics, even within their varying contexts.
The first number I would like to use is WIN SHARES, which is compiled by Sports-Reference.com. Win shares are a look at how many wins a player contributes to his team with his offensive and defensive play. Like all metrics, it is breaking down numbers and is not good at parsing out subjective or subtle factors. Things like defensive performance are limited to steals, blocks, rebounds, etc. and cannot factor in elements like on-ball defense. However, it does give us a great jumping off point and I am comfortable enough with the results to say that I would not do more than tweak these numbers. You can certainly subjectively argue away a point of win shares, but I don’t think anyone can justify moving a guy up 3 or 4 win shares (essentially doubling his value).
Another benefit of lists like this is the consistency of the Badger program during this era. We don’t have to figure out what to do with players on bad teams, an admitted weakness of my original list. How do you rank guys like Cory Blackwell or Mike Heineman or Joe Chrnelich…players who accumulated some numbers and even accolades but on mediocre teams? What would we think about Ben Brust if he got to shoot as much as Ricky Olson? For the purposes of this list however, while we have varying levels of teams, almost all players played on good teams, which helps in our analysis.
Anyway, here are all the Badger seasons since 1995, when win shares were first computed. So, you will not see players like Ricky Olson, Michael Finley, Rashard Griffith, etc. on the list.
(Also note for future reference that these numbers are before the NCAA tournament, so I would suppose there is the potential for Davis to accumulate more win shares with another outstanding 2-3+ games.)
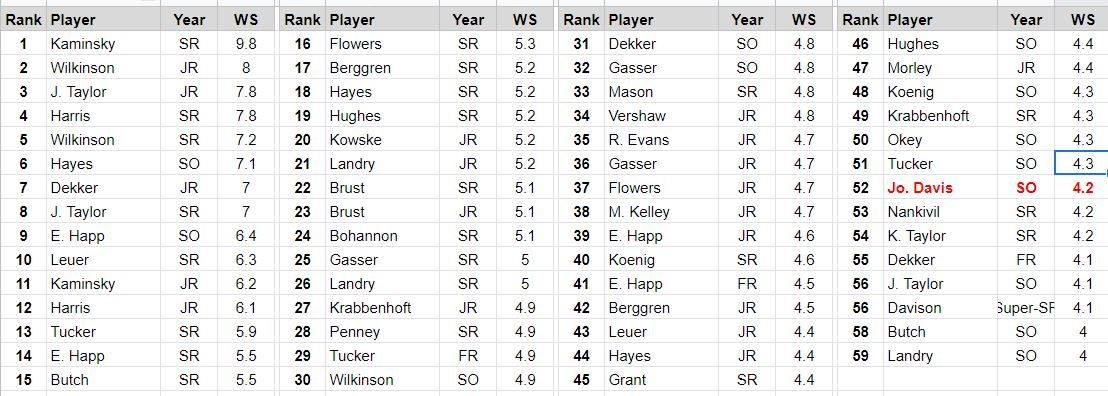
I don’t think even the harshest Davis critic would have expected his season to rank 53rd in the last 25 years behind guys like Joe Krabbenhoft, Ryan Evans, Mike Kelley, or Josh Gasser but there you have it. Obviously, nobody would rank his season as the 53rd best season, so what is going on?
The first reaction would be that these numbers are utter crap and are some computer geek trying to say that Tim Jarmusz is better than Alando Tucker. However, if we look at the top of the list, we see the names we would expect to see…Kaminsky, Harris, Wilkinson, Taylor, Dekker, etc. Before this year, if I had presented you this list, I don’t think anybody would have blinked (minus some discussion about where Alando is, which I will get to).
Is there a bias towards wings or point guards or post players? Well, the list seems to represent a pretty fair mix of types of players, so I think we are good there.
Another weakness of some evaluation tools is that it does not consider usage, but if we look at this list, most of the players were indeed front line higher usage players.There are certainly a few on the list that we will need to address, but certainly not enough to explain why Davis falls all the way to 53rd, barely ahead of Brad Davison and nowhere within shouting distance of the guys on the top.
The answer, as most of you know, is that Davis is not overly efficient. He isn’t bad by any stretch, but he falls well short when comparing him to the all-time greats. Win shares most definitely factors in production, but also whether you can produce with efficiency. Bo Ryan, better than almost all coaches of his era, understood that basketball is essentially a math equation. If I get more possessions than you do and take higher percentage shots, I am more likely to win. It is really that simple. Of all fan bases, you would think Wisconsin fans would understand this best, as they have had front row seats for two decades of greatness based on these simple principles.
In Davis’s case, he is accumulating numbers, but is also gobbling up a huge number of possessions for his team. He is shooting just 43%, 47% on 2’s, and just 31% on 3’s. His turnovers per 100 possessions is 4.0, which is the worst on the team besides Marcus Ilver’s 4.1 and well below Davison’s 1.5, Hepburn’s 2.3, Wahl’s 3.1, or Crowl’s 2.2. Now, this isn’t to say that Davis sucks because he turns it over too much, because we realize that some of that is because sometimes the best player is forced into tougher spots than some guy who is asked to do very little (Carter Gilmore is at 0.7). But, when we are comparing him to Tucker and Harris and Kaminsky and Penney and Leuer, it matters.
When we look at win share totals from other top players in the Big Ten, we get this…
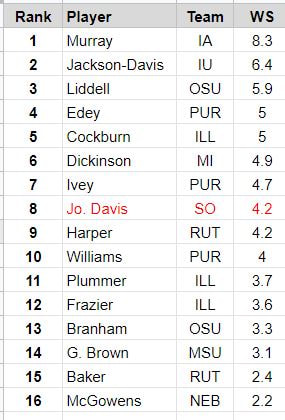
I know why Davis got POTY in the Big Ten….his team won the conference, and I think that is a reasonable conclusion for these types of awards, but in all honesty, Keegan Murray got robbed if we are talking about just being the flat out best player on paper in the league. And, I know it hurts to say this, but Davis was basically Ron Harper when it comes to Win Shares and if you look at their games, you can squint and see it (at least a little bit). Most of the guys on this list are also high usage players. Some are surrounded by inferior players. Some are wings. Some need to be high volume players for their teams to win. The arguments for that 4.2 start flitting away.
When we start to look at the total package, I don’t think we can make any real case for Davis having a better year than Murray or Kaminsky or Jordan Taylor or any of those guys above 7 Win Shares. You simply can’t make up a 3+ win share difference, regardless of whatever subjective arguments you want to try to make.
Fine, but let’s be real, Ryan Evans? Joe Krabbenhoft? Zach Morley? On that point, I think there is a valid point. While win shares give us a really solid foundation, like most stats it isn’t perfect and we need to look at more data. Let’s look at the PER (Player Efficiency Rating), which IMO gives more weight to production/usage and despite its name, actually values true efficiency less. The problem with PER is that Sports-Reference.com has only used it for the last 10 years or so, so a bunch of guys on our list are going to not be included.
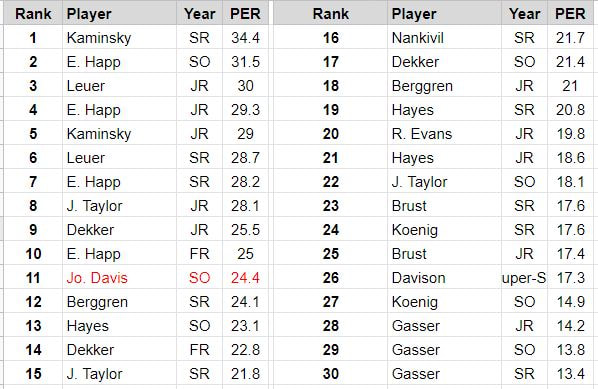
This list makes more sense in many ways, with lower usage guys like Gasser, Evans, Davison, Brust, etc. dropping well down the list. However, at the top we still see guys like Kaminsky, Happ, Leuer, Taylor, Dekker. While this stat is as friendly towards Davis as you can find, he still doesn’t crack the top 10. If you include Devin Harris, Alando Tucker, Brain Butch, I am pretty sure we would have to bump him down towards #20.
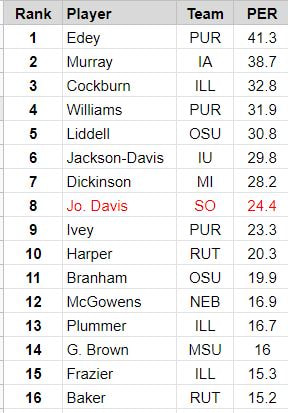
What about the Big Ten players?
What about the Big Ten players?
If you want to bump Davis ahead of some of the guys on the list for subjective things like B10 POTY or a team title, I am ok with that, but the more we play with the subjectively, the further we are from having a serious conversation as to his legacy.
Sports is full of shooting stars, that dazzle us with moments in time that we remember forever…peak Dwight Gooden breaking off a curve-ball, Bo Jackson running down the sidelines, and yes, Johnny Davis destroying Purdue in what is probably the best game I have ever seen from a Badger. It is what makes following sports fun. But, that doesn’t mean that Gooden was better than Greg Maddox, that Jackson was better than Emmitt Smith, or that Davis was better than the guys at the top of either of the lists. Yes, he propelled his name into the national conversation because of his spectacular plays, his performances in big games, and in no small part because the Badgers were the surprise of the conference and we all love to create narratives that help us explain or make sense of what we are seeing, but taking a step back, I think we are seeing more of a shooting star than a player who was a nationally elite player night after night after night.
I mentioned Alando Tucker earlier, and I think he is a pretty good comp for Davis….an athletic freak with his share of highlights and a driving force behind a nationally relevant team. At the same time, his production was not matched by efficiency and as a result, he is not quite as high on these types of lists as you might expect.
Michael Finley is another guy who is not on the list because of lack of data, but I think would have suffered in the same way, at least during his senior year.. We all had a good feeling of what he was going to be, but the numbers were the numbers (38% shooting, 29% from 3 as a senior).
For the record, if I was making my subjective list, I would bump up Alando and Johnny from their spots at #13 and #53 respectively. Championships matter. Carrying your team matters. Accolades matter. Sometimes just the “I know basketball and I know what I saw” matters. In Tucker’s case, I would put his senior year in the top 10, but I would not put him in the top 5. In Davis’s case, I would put him somewhere around #15. But, the mathematical case is just too strong to go any higher.
I am also on record as saying that we, as Badger fans, are going to be deprived of what might have been a fantastic journey should Davis have stayed for another year or two. He should leave if he is going to be a lottery pick as many expect, but figuring out that next step of combining the “Wow” factor and the raw production with better efficiency is something I think he would have figured out and would have been damn fun to watch.
Jordan Taylor was at 4.1 WS as a sophomore. Devin Harris went from 3.8 to 6.1 to 7.8. Alando Tucker was at 4.3 as a sophomore. Dekker went from 4.1 to 4.8 to 7.0. Leuer was at 2.8 as a soph before finishing up at 6.3. The list could go on.
There is a reason why the list is dominated by juniors and seniors, and I don’t think there is any reason why Davis wouldn’t have joined that upper level of the list with a normal developmental trajectory. However, that is going to be left for message boards and Twitter arguments, as all we are left with is a terrifically fun glimpse at a great player just starting to reach his potential. I have used the comparison of TJ Watt, who left early when the pros said they wanted him, and despite the holes in Davis’ game right now, I am rooting for him to take that next step that most of us think he has, just as we have seen with TJ.
